Do high protein recipes carry the protein they claim?
We recomputed 30 top-ranking high protein recipes from their own ingredients. 21 match their protein claim within 2 g or 10%. Nine miss, six by claiming more.
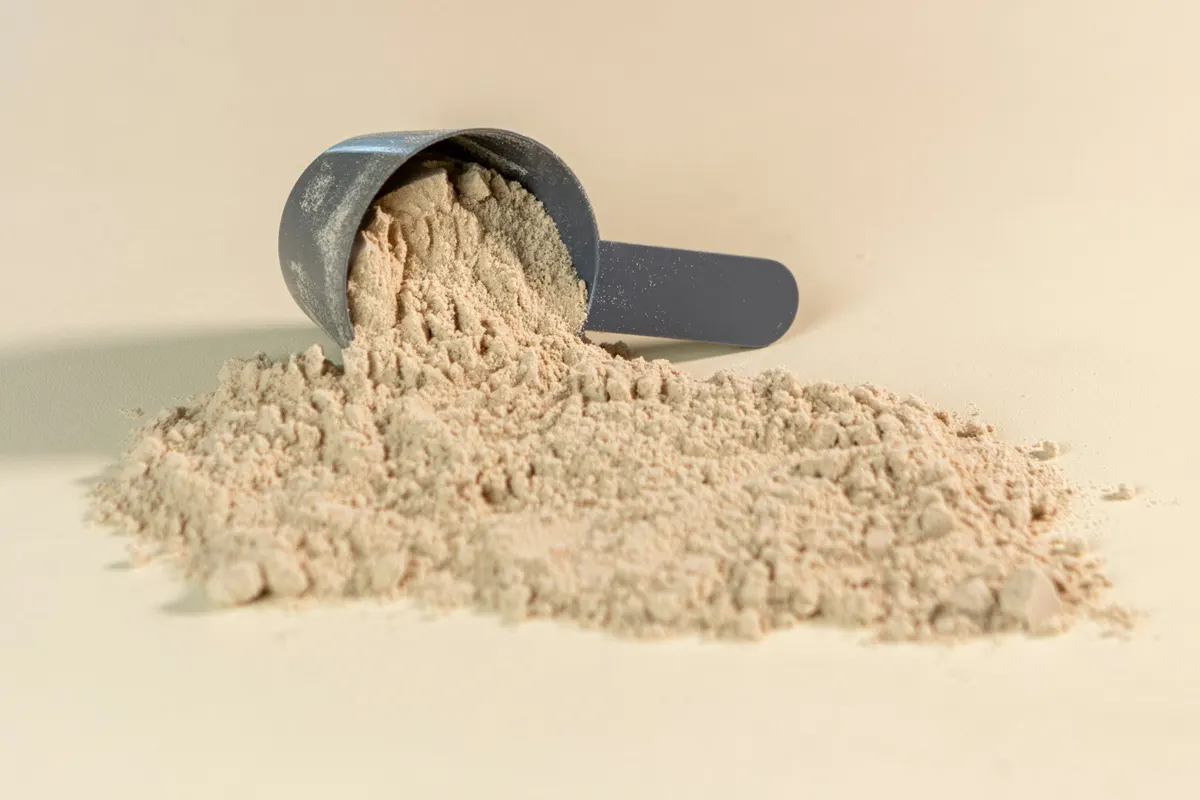
Most do. We recomputed the protein in 30 top-ranking high protein recipes from their own ingredient lists, at USDA values. 21 came within 2 g or 10% of the figure on their recipe card. Nine did not: six claimed more protein than their ingredients carry, by a median of about 4 g a serving, and three claimed less.
The six that claimed more have something in common. Five are built on protein powder, and in four of those the card only adds up if the powder is counted at one and a half to two times the amount the recipe lists.
We checked our own recipes first
On 26 September we recomputed the 13 older recipes on this site from their own ingredient lists, the same way, and rechecked the figures our guides quote. Two had the error this study is about.
- Our turkey chili said 30 g of protein a bowl. Its ingredients carry 25 g. The corrected page shows where every gram comes from, with a note saying what changed.
- Our tuna pasta said 42 g a plate. It used USDA’s entry for no-salt tinned tuna, at 25.5 g of protein per 100 g, where USDA’s main entry and US labels put it at about 19. The pasta round-up now says 35 g.
The same check led to smaller corrections on a traybake, a curry and our breakfast burritos. We are not publishing this from a position of never having done it.
What we found
The figure on the right is the card minus the recomputed figure. Red rows claim more protein than the ingredients carry and blue rows claim less, by more than 2 g or 10 percent of the card, whichever is larger. Grey rows are within that. Recomputed figures are our estimates from USDA values and product labels.
| Result | Recipes |
|---|---|
| Within 2 g or 10% of the card | 21 |
| The card claims more protein than the ingredients carry | 6 |
| The card claims less | 3 |
| Out even on the reading most generous to the card | 2 |
Across all 30, the typical card sat about 1.4 g from our figure. Most recipe cards are close, which is worth saying before anything else.
| Dish | Recipes | Within | Claims more | Claims less |
|---|---|---|---|---|
| Pancakes | 4 | 2 | 2 | 0 |
| Overnight oats | 4 | 3 | 1 | 0 |
| Breakfast burritos | 3 | 1 | 0 | 2 |
| Egg bites | 4 | 3 | 0 | 1 |
| Mac and cheese | 4 | 3 | 1 | 0 |
| Chili | 2 | 2 | 0 | 0 |
| Lasagna | 1 | 1 | 0 | 0 |
| Banana bread | 4 | 4 | 0 | 0 |
| Muffins | 1 | 0 | 1 | 0 |
| Cookies | 3 | 2 | 1 | 0 |
| All | 30 | 21 | 6 | 3 |
All four banana breads held up. Four recipes a dish is far too few to rank dishes, so read this as what we found rather than as a league table.
Protein powder recipes were the ones that claimed too much
Half the sample, 15 recipes, uses protein powder, a shake mix or collagen. Five of the six over-claims are among them. Of the 15 without powder, one over-claimed, and its card fits the regular pasta its recipe offers as an alternative rather than the gluten free pasta it lists first. None of the powder recipes claimed less than their ingredients carry.
In four of the five, the card adds up only if the powder is counted at one and a half to two times what the recipe lists: a third of a cup read as half a cup, half a cup read as four fifths of a cup or nearly a whole one, a tablespoon read as two. The fifth is a muffin recipe with a different problem, below.
We cannot see the calculator each site used, so we cannot tell you why. What we can say is where to look. Protein powder is sold by the scoop, recipes measure it by the cup, and nutrition calculators need grams. Each conversion is a chance to double something, and in a protein powder recipe the powder is most of the protein, so a mistake there moves the headline number.
How many grams of protein powder is in a cup?
About 96 g for whey, by USDA’s figure of 32 g for a third of a cup. That puts half a cup at about 48 g and 38 g of protein.
| Measure | Whey | Protein |
|---|---|---|
| 1 tablespoon | 6 g | 5 g |
| 1/4 cup | 24 g | 19 g |
| 1/3 cup | 32 g | 25 g |
| 1/2 cup | 48 g | 38 g |
| 1 cup | 96 g | 75 g |
Brands differ, and by more than you would guess. Naked Whey’s label puts its 30 g serving at 6.4 tablespoons, which makes half a cup about 38 g, while one recipe in the study weighed half a cup of Puori whey at 50 g. A scoop is not a unit either: across the four powders these recipes name, a scoop holds from 15 g to about 33 g. If the number matters to you, weigh the powder.
Two cards were divided by the wrong number of servings
The two recipes that miss on every reading of their ingredients fail the same way. Their calories are out by the same factor as their protein, which is what you get when a batch is divided by the wrong number.
- A muffin recipe makes 12 muffins, and its card fits 8. Calories and protein both come to about one and a half times what a twelfth of the batch carries.
- An egg bite recipe makes six servings of two bites, and its card fits seven. Calories, fat and protein are all 14 to 19 percent low.
When the calories and the protein on a card are off by the same factor, check the serving count first. It is also the quickest fix in this whole study.
The three that claimed less
Two breakfast burritos and one of the egg bite recipes published less protein than their ingredients carry. The egg bites are the serving count above. One burrito card fits a tortilla with about 4 g of protein, where Mission’s large Carb Balance tortilla carries 10, which may be a difference of brand rather than a mistake. The other burrito has no single ingredient that explains its gap.
Under-claiming is the kinder error for most readers. It is still an error for anyone counting toward a target, who will eat more than they need to reach it.
How to calculate macros for a recipe yourself
- Write down every ingredient with its amount, including anything listed to serve.
- Turn each amount into grams. The label gives a gram weight per serving, and USDA FoodData Central lists cup and spoon weights for most foods.
- Look up the protein, carbs and fat per 100 g, from the same label or entry.
- For each line, multiply the grams by the figure per 100 g and divide by 100.
- Add up the lines for the whole batch, and divide by the number of servings the recipe makes.
For protein, two checks catch most of what we found: whether the powder line matches the amount the recipe lists, and whether the card’s serving count matches the recipe’s. Our own recipes show this sum as a table, as the high protein pancakes do, so you can check them too.
How we did it
- The sample. Google results in the United States for ten searches, read with OpenRush on 27 and 28 September 2026: high protein pancakes, protein overnight oats, high protein breakfast burrito, high protein mac and cheese, high protein chili, high protein lasagna, high protein banana bread, protein muffins, protein cookies recipe and high protein egg bites.
- The rule, fixed before any result was read. Single recipe pages whose recipe card publishes protein per serving, up to four a search in rank order. Videos, forums, social posts and round-ups were left out. That gave 30 recipes, fewer than four where the top results had no card.
- The published figure. The protein per serving in each page’s recipe card markup, read on 28 September 2026.
- Our figure. Each ingredient line in grams, valued at USDA FoodData Central, or at the product label where the recipe names a brand. Where USDA’s own entries disagree, we use the one that matches US shelves, the rule our own recipes follow.
- Two readings. Where a recipe leaves a choice open, such as milk of choice or 6 to 8 ounces of cheese, we took a typical reading and also the reading most generous to the card. Where a line names alternatives, the typical reading takes the first one listed. Optional ingredients are counted unless the card says it leaves them out.
- The tolerance. A card is within tolerance if it is within 2 g or 10% of our figure, whichever is larger, which allows for ordinary differences in brands and measuring.
A gap is a reason to check a card, not proof of a mistake: we cannot see how each site did its sums, and your brands can move a figure either way. We have not named the sites. The pattern is the point, and every gap here would take minutes to fix.
The data
The figures for all 30 recipes are in a CSV file, with no site names: the dish, the servings, the card’s protein, ours, the lowest and highest readings, the gap, and what the card’s figure fits where it misses. Use it freely, with a link back to this page.
Every figure here, ours included, is an estimate. Why recipe macros are estimates explains where the error comes from and how far it moves with the brands you buy.
Common questions
Turn every ingredient into grams, multiply each by its protein, carbs and fat per 100 g from the label or USDA FoodData Central, add up the batch, and divide by the number of servings the recipe makes. Then check that serving count against the recipe: two of the 30 recipe cards we checked were worked out for a different number of servings than their recipes make.
For each ingredient, grams multiplied by the nutrient per 100 g, divided by 100. Add those up for the whole batch and divide by the number of servings. The same sum works for protein, carbs, fat and calories, as long as every line is in grams first.
It depends on the brand, because a scoop is not a standard size. The four powders named in the recipes we checked have scoops from 15 g to about 33 g. A 30 g scoop of whey is close to a third of a cup, which USDA puts at 32 g.
About 19 g for whey. USDA puts a third of a cup at 32 g, so a quarter cup is about 24 g, and whey powder is about 78 percent protein by USDA's figure. Flavoured and plant powders carry less per gram, so the label on your tub is the better guide.